Join 8,587 professionals who get data science tutorials, book recommendations, and tips/tricks each Saturday.
New to Python and SQL? I'll teach you both for free.
I won't send you spam. Unsubscribe at any time.
Issue #1 - Data Profiling for Machine Learning
This Week’s Tutorial
You can get the CSV files from the newsletter's GitHub repository if you want to follow along.
The best machine learning (ML) models and clusterings are born of the best data. But how do you know if you have the best data?
You profile it!
Studies of data science projects reveal that 60-80% of the project effort is acquiring, understanding, cleaning, and transforming data.
My experience in the data science trenches matches these studies. Sometimes, it's even more!
Think of data profiling not only as a required aspect of your data science work, but also a disproportionately valuable aspect of your work.
You want the best data for your ML models and clusterings, right?
This week, I want to introduce you to my favorite Python library for profiling your data - the mighty ydata-profiling.
As ydata-profiling isn't included with base Python, you need to install the library, and it's dependencies.
I'm a big fan of Anaconda Python (which I use in all my courses), so I will show you how to install ydata-profiling with Anaconda.
NOTE - The screenshots are from Mac, but the commands are the same for Windows. You use the Anaconda Prompt on Windows instead of the Mac Terminal.
First up, the ipywidgets library needs to be updated:
Next, installing ydata-profiling:
The magic of ydata-profiling is that it will generate a rich HTML report right inside your Jupyter Notebook with just a few lines of code:
Running the code above starts a bunch of data profiling goodness:
The end result is an HTML report that's jam-packed with information about your dataset:
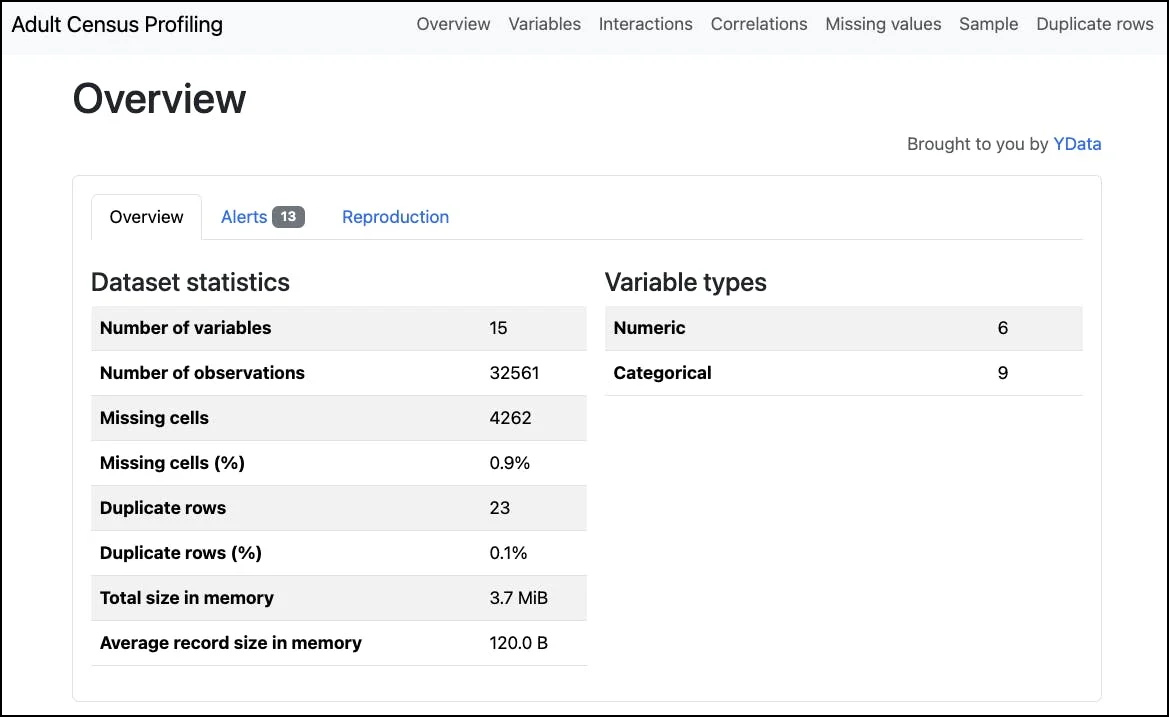
Here's a closer look at the Overview section of the report:
You get a ton of information about your dataset all up:
The number of variables (columns/features).
The number of observations (rows).
Is there any missing data?
Are there any duplicate rows?
The first two bullets are interesting, but the real magic is in the report of missing and duplicate data.
Many ML techniques (algorithms) will not work with missing data. Even a single cell with missing data will cause these ML algorithms to throw an error.
Luckily, some of the most useful real-world ML algorithms can handle missing data, but that's a subject for a future newsletter.
In general, missing data is a problem for ML.
Duplicate rows are special in ML because sometimes they are not a problem at all. In fact, they are expected.
The dataset used in this tutorial is from the US Census Bureau. Think of each row as a US citizen and the features as being characteristics of the citizen.
For example, age, education, job type, etc.
Not surprisingly, when representing US citizens at this abstraction level, it makes sense that the dataset will contain duplicate rows.
Moving on, ydata-profiling attempts to determine the data types of the dataset features:
In general, ydata-profiling does a pretty good job of figuring this out, but it isn't perfect.
Future newsletters will discuss how to profile each different type (e.g., date-time features) for ML.
Lastly, and most importantly, there are the Alerts:
I can't adequately express the awesomeness that is the Alerts section.
It provides you with a list of potential data issues you must consider long before writing any Python ML code.
Future newsletters will cover this in greater detail, but let me give you a couple of great examples:
The work_class feature has 5.6% of its values missing.
95.3% of captial_loss feature values are zero.
That's gold, Jerry! Gold!
Oh, one last thing I should mention about what you've learned today.
Not only am I teaching you what I do as a data science consultant, but it's also exactly the same thing I teach at conferences, in my online courses, and for my corporate clients.
This is the good stuff.
This Week’s Book
I'm often asked for resources from professionals wanting to jumpstart their knowledge of statistics.
While knowledge of statistics isn't necessarily required for many DIY data science techniques (e.g., cluster analysis), learning statistics can help shape your data science mindset.
The single best book I've found on building an intuition of statistics is the following book by Jim Frost:
Introduction to Statistics is written for any professional, regardless of your math background, and you can get the Kindle edition for only $9!
That's it for this week.
Next week's newsletter will cover how to use ydata-profiling to assess the quality of your numeric features for machine learning.
Stay healthy and happy data sleuthing!
Dave Langer
Whenever you're ready, there are 4 ways I can help you:
1 - Are you new to data analysis? My Visual Analysis with Python online course will teach you the fundamentals you need - fast. No complex math required, and it works with Python in Excel!
2 - Cluster Analysis with Python: Most of the world's data is unlabeled and can't be used for predictive models. This is where my self-paced online course teaches you how to extract insights from your unlabeled data.
3 - Introduction to Machine Learning: This self-paced online course teaches you how to build predictive models like regression trees and the mighty random forest using Python. Offered in partnership with TDWI, use code LANGER to save 20% off.
4 - Is machine learning right for your business, but don't know where to start? Check out my Machine Learning Accelerator.


