
Join 1,000s of professionals who are building real-world skills to truly harness the power of AI technologies like Microsoft's Copilot in Excel.
Issue #10 - The Spectrum of ML Model Interpretability
This Week’s Tutorial
While not required for this tutorial, knowledge of logistic regression and decision trees is a bonus. Get this knowledge with my free ML crash courses.
If you want to write your code to follow along, you can get the dataset from The DIY Data Scientist GitHub.
The following machine learning algorithms are widely discussed as the go-to for high levels of interpretability:
Linear regression
Logistic regression
Decision trees
As linear and logistic regression are closely related (technically, they are both forms of generalized linear models), this tutorial series will focus on logistic regression.
When discussing model interpretability, everything discussed about logistic regression applies to linear regression at a high level (e.g., feature interactions).
The easiest way to discuss the spectrum of ML model interpretability is with some examples. This tutorial series will use the Heart dataset initially sourced from the UCI Machine Learning Repository:

When using logistic regression for data analysis, the best Python library is statsmodels. For example, statsmodels is "pandas-aware" and recognizes categorical columns and automatically handles them in logistic regression models.
The Heart dataset has several categorical features. Binary (i.e., 0/1) features are fine as-is, but the categorical features with three or more levels can be set to be categorical using pandas:

Let's say you're building a logistic regression model to understand the factors highly associated with heart disease. You think the following factors are a good place to start:
Male (as defined in the dataset)
Age
ChestPainType
It's always a good idea to start your modeling with a simple model, even though more features are available in the dataset. A simple model is a good way to vet your subject matter expertise and establish a baseline:

Here's where the interpretability of logistic regression really shines - the model coefficients:
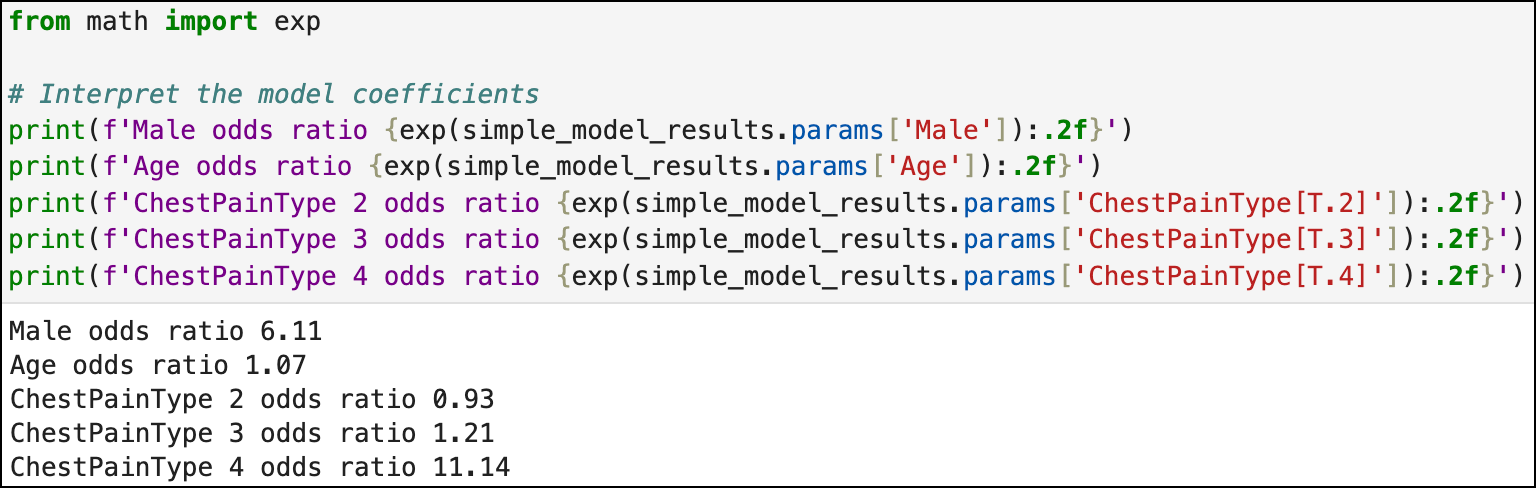
Here's how the model's odds ratios you see above translate to natural language:
Patients that are Male are 6.11 times more likely to have heart disease.
For each additional year of Age, patients increase their relative risk of heart disease by 7%.
Patients with ChestPainType 4 are 11.14 times more likely to have heart disease compared to patients with ChestPainType 1.
What makes logistic regression so interpretable? Not only is the above language quite intuitive, but each feature's interpretation is considered in isolation from other model features.
Typically, business stakeholders also want to know about the model's effectiveness. One way to do this is to calculate the model's predictive accuracy:

Using just these three features, the logistic regression model predicts heart disease with 77% accuracy - for this dataset.
Here's the thing, though.
In real-world DIY data science, the best models use many features:

The "complex" model coefficient odds ratios:

And the "complex" model accuracy:

Using more features, the "complex" model increases predictive performance (i.e., accuracy) by more than 4%! It's possible that adding even more features will further increase predictive performance.
The above situation is common with logistic/linear regression models - the most effective models are better (e.g., higher accuracy) and more challenging to interpret.
As covered in the last tutorial, humans tend to see explanations involving 1-3 factors as the best. In the case of the "complex" model, which 1-3 odds ratios do you choose?
Let's say that you go with the 3 highest odds ratios. However, you must also consider how common the odds ratio is in the dataset. Humans perceive common/general explanations as the best.
For example, ChestPainType 4 has the highest odds ratio, but how common is this value in the original dataset? As it turns out, 47.8% of the ChestPaintType values are 4.
This type of percentage calculation is known as support. Support is an essential concept in ML model interpretability. Humans perceive high support as a general (i.e., good) explanation.
BTW - What's perceived as "high support" is usually defined by your business stakeholders. This is a good thing to determine before offering any model interpretations.
Let's put logistic regression on hold and look at decision tree models.
First, preparing the data:

We can limit the tree's size to three levels deep using a decision tree. This allows for hitting the 1-3 factors "sweet spot" for good explanations:

Visualizing decision trees is the best way to interpret them:


And the decision tree's accuracy:

In my experience, simple (i.e., short) decision trees are far more interpretable to business stakeholders. Consider the following:
The decision tree accuracy is higher than the previous logistic regression models.
The decision tree picked the best features from the dataset to split the labels.
Decision trees implicitly include interactions of features.
Think about that last bullet point for a second. Logistic/linear regression models do not include feature interactions by default. Each feature coefficient is interpreted in isolation.
If you want interactions, you must add them explicitly to logistic/linear regression models. Here's the thing, though.
Adding interactions in logistic/linear logistic regression models dramatically increases the complexity of interpretation.
I once provided ML training to a client that used logistic regression models. This client never used interaction effects in their logistic regression models because their stakeholders couldn't understand them.
However, interpreting interactions with decision trees is easy. Consider the following path through the tree highlighted in red:

In natural language, you can interpret this path as:
Patients with Thal scores of six and seven, Flourosopy values greater than 0.5, and BloodPressure over 109 are predicted to have heart disease with 93.6% accuracy.
The support of this prediction is 23% of the dataset's observations.
Now that's what I call a good explanation!
As with logistic/linear regression models, decision trees often become more powerful (i.e., better predictions) when you increase the model complexity. The following decision tree model is 93.33% accurate:

In my experience, a model like the above (i.e., five levels deep) is usually at the edge of what business stakeholders will see as providing good explanations by directly inspecting the model.
However, it's common in real-world DIY data science to place a premium on predictive model performance (e.g., accuracy), while simultaneously needing interpretability for business stakeholders.
We need techniques for interpreting ML models that don't rely on directly inspecting the models. With these techniques, we are free to:
Make logistic/linear regression and decision tree models as complex as necessary.
Use even more powerful models like the mighty random forest.
You will learn these techniques in this tutorial series.
This Week’s Book
If you can't wait for the entire tutorial series on ML model interpretability, check out this great book. It's freely available online:

That's it for this week.
Stay tuned for next week's newsletter, where I will cover confusion matrices and permutation importance for ML interpretability.
Stay healthy and happy data sleuthing!

Dave Langer
Whenever you're ready, there are 4 ways I can help you:
1 - Are you new to data analysis? My Visual Analysis with Python online course will teach you the fundamentals you need - fast. No complex math required, and Copilot in Excel AI prompts are included!
2 - Cluster Analysis with Python: Most of the world's data is unlabeled and can't be used for predictive models. This is where my self-paced online course teaches you how to extract insights from your unlabeled data. Copilot in Excel AI prompts are included!
3 - Introduction to Machine Learning: This self-paced online course teaches you how to build predictive models like regression trees and the mighty random forest using Python. Offered in partnership with TDWI, use code LANGER to save 20% off.
4 - Is machine learning right for your business, but don't know where to start? Check out my Machine Learning Accelerator.